Montgomery County Town-by-Town Price Appreciation
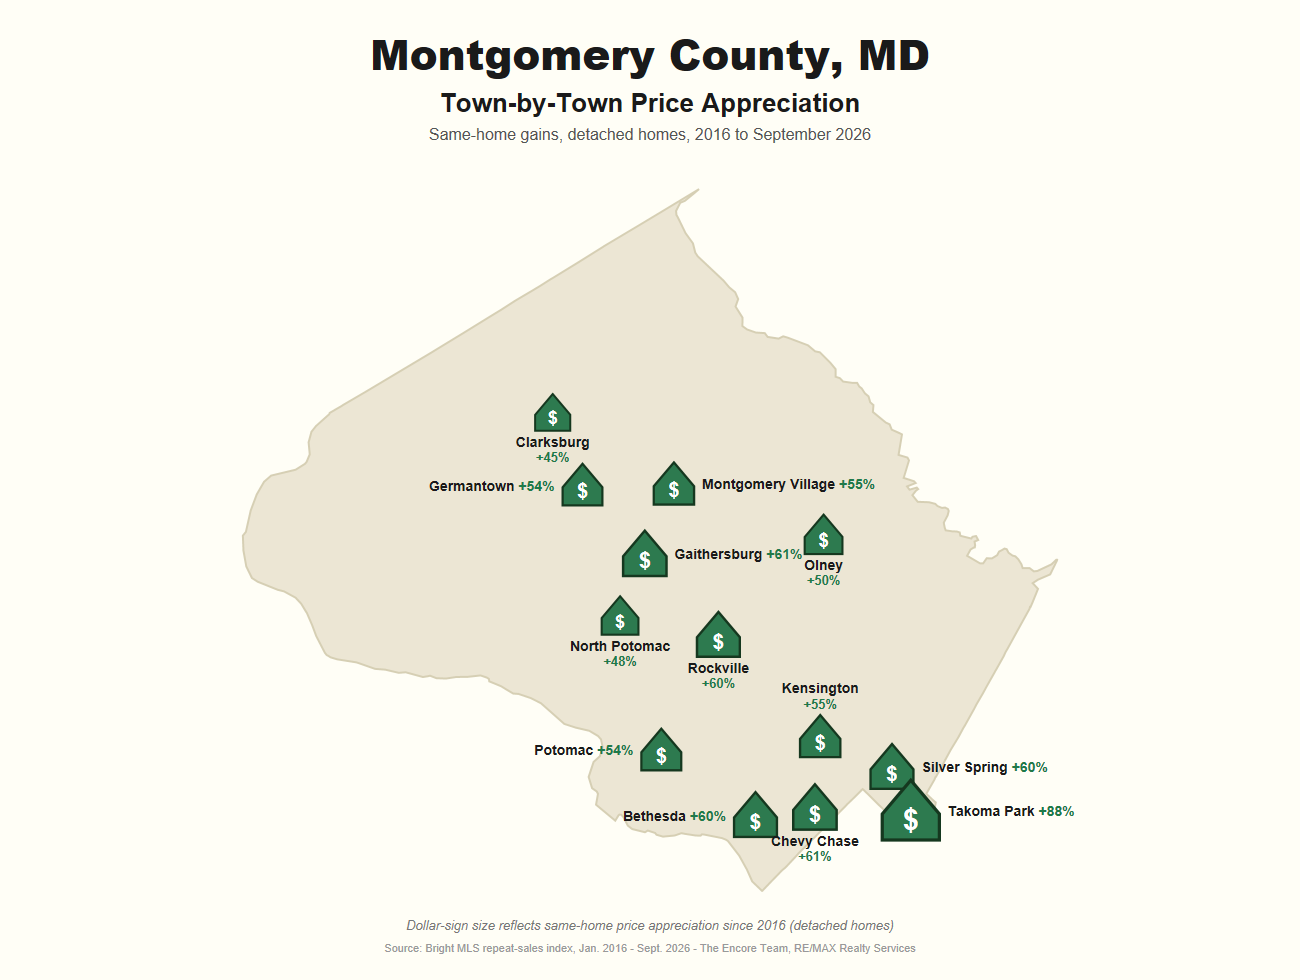
In our first three reports we looked at how detached homes, townhouses, and condominiums across Montgomery County have appreciated since 2016 — not by the average sale price, which shifts with whatever mix of homes happens to sell, but by tracking the same home selling more than once. The countywide answer was about 59% for detached homes and 53% for townhouses. The question we heard most in response was, “Fine, but what about my town?” So this time we ran the same analysis for 13 communities, using 102,068 closed sales through September 23, 2026 and 11,092 matched repeat sales.
Part 1: Detached Homes by Town
Same-Home Appreciation, 2016 to September 2026
| Town | Sales 2016–26 | Since 2016 | Since 2019 | Last 12 Mo. | Median Price 2026 |
|---|---|---|---|---|---|
| Bethesda | 8,379 | +59.6% | +32.3% | +3.1% | $1,500,000 |
| Chevy Chase | 2,663 | +61.1% | +41.6% | +7.1% | $1,600,000 |
| Clarksburg | 1,709 | +45.4% | +37.0% | +2.7% | $877,000 |
| Gaithersburg | 6,032 | +61.2% | +46.6% | +1.6% | $765,000 |
| Germantown | 2,717 | +54.0% | +41.9% | +0.5% | $745,000 |
| Kensington | 2,645 | +54.8% | +29.5% | +1.5% | $930,000 |
| Montgomery Village | 722 | +54.6% | +44.0% | −0.2% | $630,000 |
| North Potomac | 1,550 | +48.2% | +42.6% | −1.7% | $1,040,000 |
| Olney | 1,707 | +50.3% | +44.8% | −0.2% | $800,000 |
| Potomac | 5,050 | +53.8% | +46.1% | −5.6% | $1,377,500 |
| Rockville | 9,228 | +60.0% | +39.7% | +1.1% | $721,750 |
| Silver Spring | 16,806 | +59.9% | +37.7% | +1.4% | $660,000 |
| Takoma Park | 1,422 | +87.9% | +32.8% | −0.1% | $812,500 |
| All of Montgomery County | 67,919 | +59.2% | +39.4% | +0.9% | $859,000 |
Same-Home figures are from a repeat-sales index for each town. “Last 12 Mo.” compares 2026 year-to-date with 2025. Median Price 2026 is the median closed price January 1 through September 23, 2026.
What stands out: Takoma Park is the runaway leader, with a typical detached home worth about 88% more than in 2016 — nearly 30 points ahead of the county. Its small, walkable, close-in housing stock and Metro access drew exactly the buyers the pandemic created. Gaithersburg, Chevy Chase, Rockville, Silver Spring, and Bethesda all cluster right around the countywide 59–61%, which says the gains were broad rather than concentrated in one price tier: a $500,000 Gaithersburg rambler and a $1.5 million Chevy Chase colonial appreciated at nearly the same rate.
The lowest gains, 45–50%, were in Clarksburg, North Potomac, and Olney. Clarksburg was still building out in 2016, so many of its early sales were brand-new homes carrying a new-construction premium that the resale market did not fully repay; North Potomac and Olney are larger-lot suburbs farther from Metro, which mattered less to buyers in 2016 than it does now. Over the past twelve months most towns are flat to slightly up, with Potomac the exception: its same-home index has given back about 6% this year after a strong 2025, which is the luxury segment feeling higher rates most.
Part 2: Townhouses by Town
Same-Home Appreciation, 2016 to September 2026
| Town | Sales 2016–26 | Since 2016 | Since 2019 | Last 12 Mo. | Median Price 2026 |
|---|---|---|---|---|---|
| Bethesda | 987 | +25.7% | +22.8% | +3.7% | $895,000 |
| Chevy Chase * | 291 | +30.5% | +28.6% | +11.0% | $1,200,000 |
| Clarksburg | 2,276 | +48.5% | +38.2% | −0.8% | $585,000 |
| Gaithersburg | 6,927 | +55.8% | +41.0% | −0.5% | $465,000 |
| Germantown | 6,619 | +65.0% | +43.7% | +1.6% | $428,500 |
| Kensington | 129 | n/a | n/a | n/a | $735,000 |
| Montgomery Village | 2,604 | +64.8% | +44.0% | −1.7% | $465,000 |
| North Potomac * | 483 | +40.0% | +39.2% | −7.2% | $540,000 |
| Olney | 1,239 | +58.9% | +44.5% | +6.9% | $522,700 |
| Potomac | 897 | +43.7% | +36.8% | +2.1% | $832,500 |
| Rockville | 3,700 | +33.5% | +28.5% | −0.7% | $720,000 |
| Silver Spring | 5,009 | +51.0% | +33.1% | −0.8% | $465,000 |
| Takoma Park | 40 | n/a | n/a | n/a | $485,000 |
| All of Montgomery County | 34,149 | +52.8% | +38.2% | −0.1% | $504,975 |
Kensington and Takoma Park have too few townhouse resales to measure reliably and are shown for sales counts and prices only. * Based on 30–60 repeat sales; treat as approximate.
What stands out: The townhouse map is almost the reverse of the detached map. The biggest gains are in the most affordable communities — Germantown (+65%), Montgomery Village (+65%), Olney, and Gaithersburg — where a typical townhouse sold for $250,000–$330,000 in 2016 and now sells for $430,000–$520,000. These were the homes that first-time buyers could still reach as rates rose, and competition for them has been intense.
At the other end, Bethesda (+26%), Chevy Chase, and Rockville townhouses gained the least, roughly half the county rate. A townhouse in those towns competes with condos and with detached homes in nearby, less expensive areas, and at $700,000 to $1.2 million the pool of buyers is thinner. Clarksburg’s townhouses, most of them built since 2005, gained a solid 48%. Over the last twelve months townhouse values are flat almost everywhere, with North Potomac showing the largest dip and Olney and Chevy Chase the only meaningful gains — though the Chevy Chase figure rests on a small number of sales.
What Has Your Home Done?
Town-level numbers get closer than countywide ones, but values still vary from neighborhood to neighborhood and street to street. If you would like a same-home analysis for your own house or townhouse, or a no-obligation look at what it would bring in today’s market, we would be glad to put one together for you.
The Encore Team · RE/MAX Realty Services
Cell: 240-351-8214 · Office: 240-403-0400 x319
charlie@theencoreteam.net
About the numbers: Sales data: Bright MLS, all closed detached and townhouse (Interior Row and End of Row) sales in Montgomery County, MD, with close dates from January 1, 2016 through September 23, 2026 (102,068 sales). Each home was assigned to the town shown on its most recent sale. Same-home figures come from a repeat-sales index estimated separately for each town and property type from pairs of sales of the same address at least 12 months apart, excluding pairs where the above-grade square footage changed more than 15% or the price ratio was outside 0.5–3.0; towns with fewer than 30 usable pairs are not measured. Towns not listed (Boyds, Burtonsville, Damascus, Derwood, Poolesville, and others) are included in the countywide totals. 2026 figures are year-to-date and will change as the year closes out. Information deemed reliable but not guaranteed.